Analyzing Mobile Survey Results in pbSmart Codes
When setting up a QR Code and Mobile Campaign using pbSmart™ Codes, you have the option of asking customers to complete a mobile survey. To bring you this feature, Pitney Bowes has partnered with MoboSurvey, an easy-to-use survey creation tool which is ideal for both web and mobile campaigns. To include a mobile survey in your campaign, simply add the “MoboSurvey” button to your campaign’s mobile web page, after which you will be prompted to enter a link to your MoboSurvey.
This short guide shows you how to find and analyze your mobile survey results. To learn more about our mobile survey functionality, please view our video.
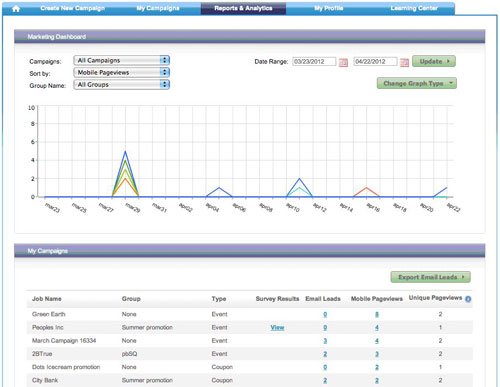
Once your QR campaign is live and you have received some scans, you will see your campaign listed in a table in the Reports & Analytics section of pbSmart Codes: 
If your campaign includes a mobile survey, the “Survey Results” column will contain a link to View your survey results. Clicking the link takes you to MoboSurvey.com, where you may need to provide your login details. After doing so you are brought to the Reports tab in MoboSurvey, with the results of your campaign survey displayed.

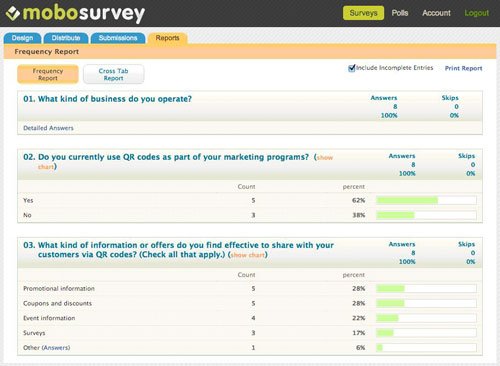
On the main reports page you will see a list of your survey questions and responses.
Two buttons at the top provide different options for viewing your survey results: the Frequency Report shows the number and percentage of responses across all questions; the Cross-tab Report* shows the relationship between two or more survey questions. A Print button is also provided to allow you to view results offline. If you would like to view results for complete survey responses only, clear the checkbox at the top.
For each survey response, you will see both the number and percentage of responses to each question, along with the number of respondents who skipped any optional questions.
Depending on the type of question, you will see different options to view additional results. For multiple choice and Yes/No questions, the Show Chart* link displays a visual breakdown of responses.
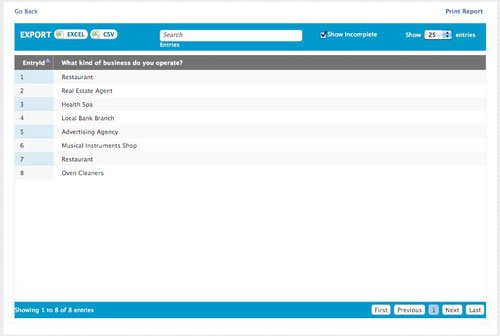
In our sample survey, Question 1 was an open-ended question with a text box for respondents to provide their answers. To view these responses, click the Detailed Answers link to see how each individual responded: 
In the detailed view, you can flip through various pages of responses using the buttons at the bottom of the results page. You can search for responses by keyword or filter out respondents who did not complete the entire survey using the checkbox at the top. If you would like to analyze your results offline, you can download them to a spreadsheet in Excel or CSV format using the buttons provided. Use the Go Back link to return to the main results page.
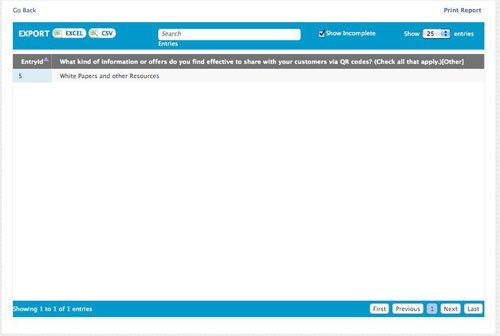
Question 3 in our sample survey was a multiple choice question with an “Other” option that allowed respondents to type in their own answer. To view these types of responses, click the Answers link next to the word “Other”. This brings up a report with similar features to the Detailed Answers report: 
And that’s it! With the integration of MoboSurvey and pbSmart Codes, you have an easy-to-use, powerful tool to gather customer insights with your QR code campaign.
* Note, this feature requires an upgraded membership plan with MoboSurvey.
WHAT NEXT?:
This article showed you how to find and analyze the results of your QR code mobile survey. For tips to keep track of your QR code campaign and for a detailed guide to setting up a survey, see our videos.